Predictive analysis gives marketers the ability to understand the behavior and profitability of each customer. The goal of predictive marketing is to increase Customer Lifetime Value (CLV) through more personalized, effective, and profitable campaigns.
Next, we will learn how to use Pleasepoint’s software to design a predictive marketing strategy and start executing it within a few days.
The post is divided into these five parts:
Post Index
The example we will follow is based on a retail chain (with physical stores and eCommerce) in the perfume industry.
You will now learn how to identify purchasing habits and behaviors. You will use predictive analysis algorithms and incorporate them into your marketing strategy. By following these steps, you will improve the profitability of your marketing efforts and increase the return from each customer.
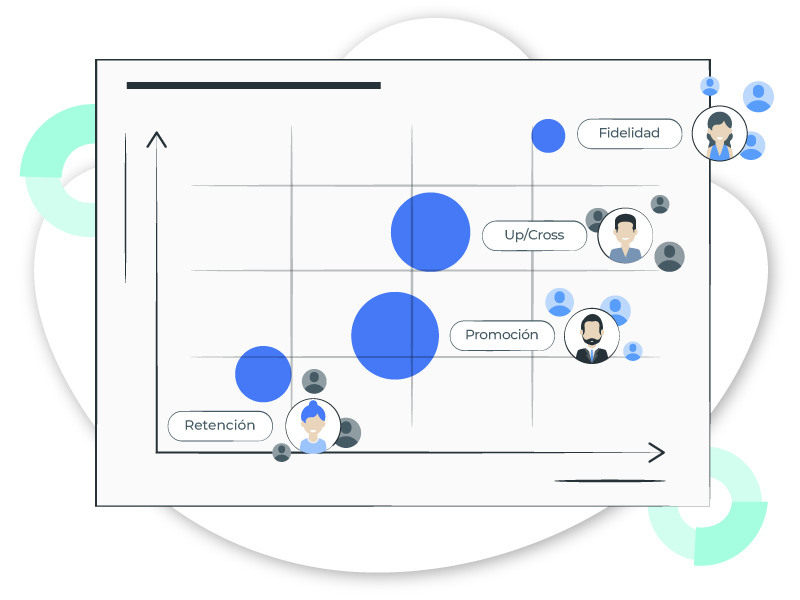
The success of predictive marketing centers on the value each customer brings and seeks to increase this value for every customer.
By performing this exercise and using it as an initial foundation for your predictive marketing strategy, you will gain the following benefits:
- Customer segmentation based on contributed value (CLV level).
- Knowledge of each customer’s preferences and consumption habits.
- Rationalization of promotional policies to improve margins.
- Personalization of communications to increase conversion rates.
- Loyalty from the best customers to retain those who provide the most value.
- Optimization of new customer acquisition with lookalike audiences of your best customers.
After following this predictive marketing guide, you will be able to segment your customers based on their profitability level and will have the ability to discover homogeneous customer audiences with shared consumption behaviors and habits.
If you’re interested in learning more about how to apply predictive marketing techniques to your marketing strategy, don’t hesitate to sign up for our next predictive marketing webinar.
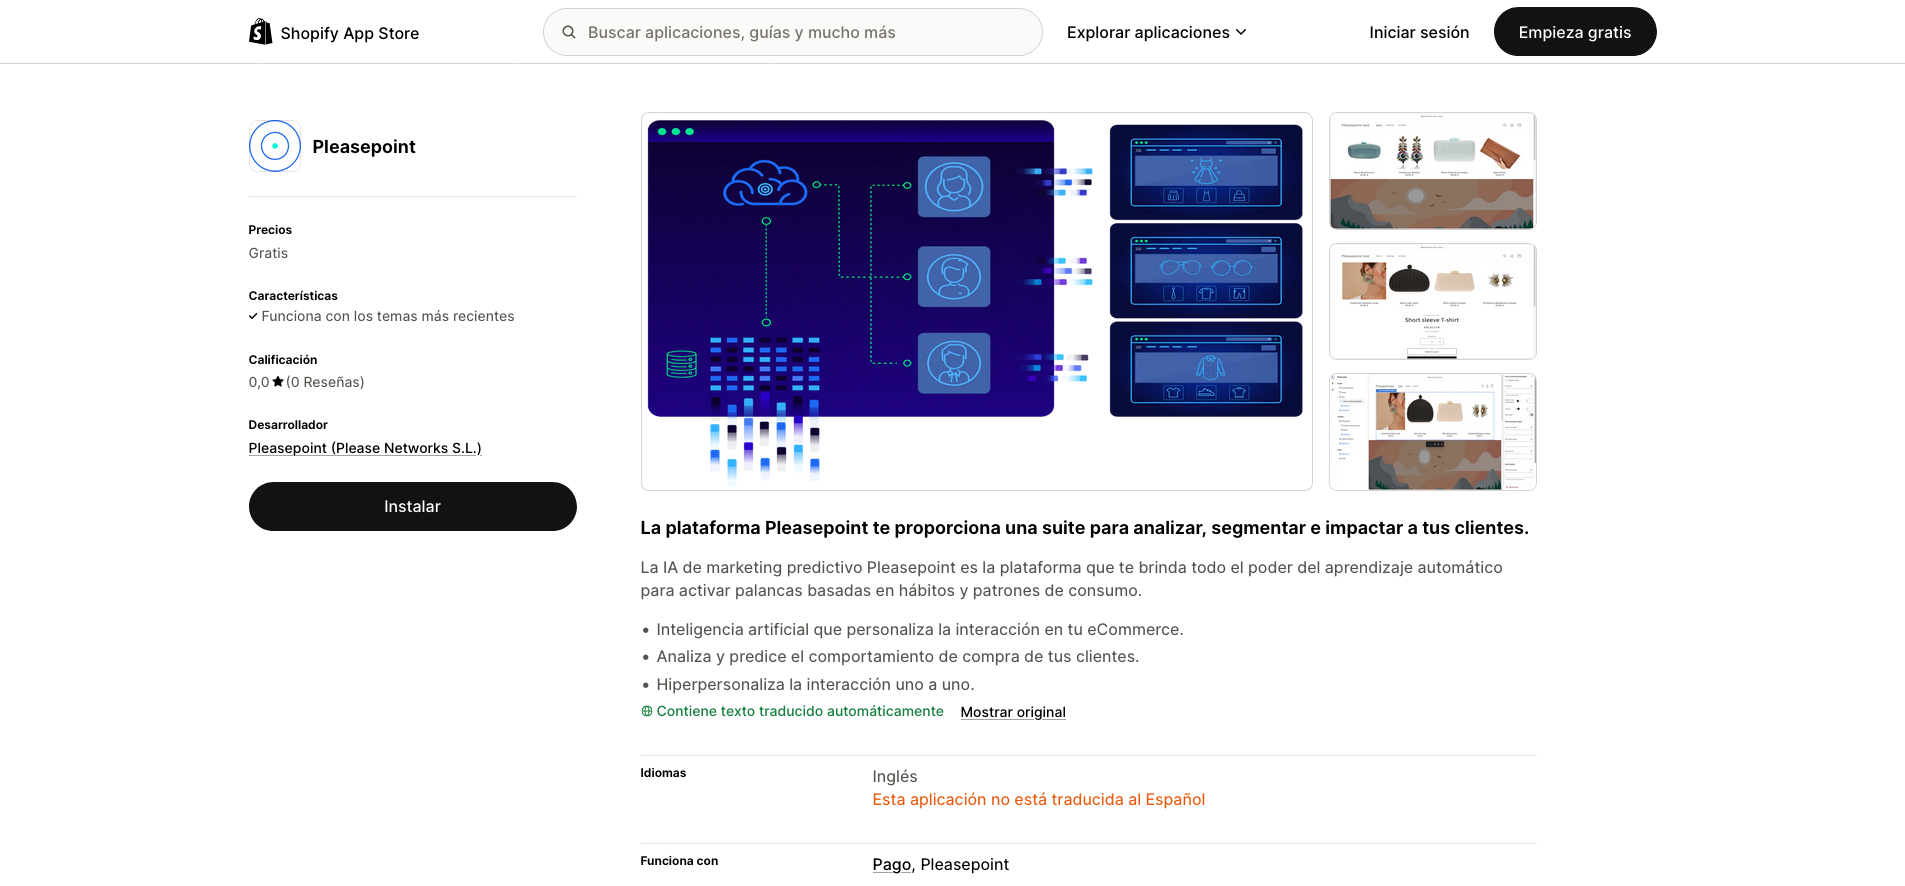
Utiliza la Inteligencia de Pleasepoint para aumentar el ROI de tus acciones de CRM, marketing y publicidad digital.
Pleasepoint es la plataforma de machine learning que segmenta los clientes de tu CRM con predicciones de compra por cliente y personaliza tu marketing digital a escala.
Solicita una demo para ver las ventajas de trabajar la segmentación de clientes utilizando el Customer Lifetime Value, personalizando según el perfil de buyer-persona basado en datos y la recomendación de productos one-to-one.
Solicita una demoBefore continuing with the guide, let's make a brief introduction about the advantages of predictive analysis compared to the manual segmentation that has been done for years. If you already have a solid understanding of predictive marketing, you can skip directly to the next section.
Which is better: manual segmentation or predictive analysis?
Manual segmentation is the process of filtering or creating groups of customers based on the value of one or more variables.
An example of manual segmentation would be grouping male customers who have purchased a specific product in the past. Another possible segmentation would be grouping customers aged between 30 and 40 with an average ticket value of more than €75 and who haven’t purchased in more than 90 days.
To create manual segmentation, you first mentally select the customers you want to target.
Predictive analysis allows you to calculate each customer’s profitability levels and identify customer groups with shared consumption habits and behaviors.
In this case, the algorithms help you discover an audience with similar characteristics, and your mission is to communicate in the most personalized way possible to increase conversion to sales.
Another advantage of predictive analysis applied to marketing is the ability to process large amounts of data. We can use customer attributes (age, gender, city, etc.), purchase history (tickets and ticket lines with discounts and returns), and behavior or interaction data.
In this post, you will learn to leverage clustering algorithms easily and automatically, without manually creating datasets or needing technical knowledge of development or databases.
1. What do I need to perform the exercise with my data?
The first requirement is to have identified purchases. If you run an eCommerce business, this won’t be a problem. If you also have physical stores with a system to identify purchases from loyal customers, we recommend using both data sources.
We will work initially with the following data:
- Customer data: sociodemographic attributes, email interaction statistics, conversion statistics...
- Product data: family, subfamily, materials, formats, functions... The more extensive the product categorization, the more precise the customer-person analysis will be.
- Transactional data: tickets and ticket lines, including discount information, promotions, sales channels, returns...
Let’s get started. Create your free Pleasepoint account now.
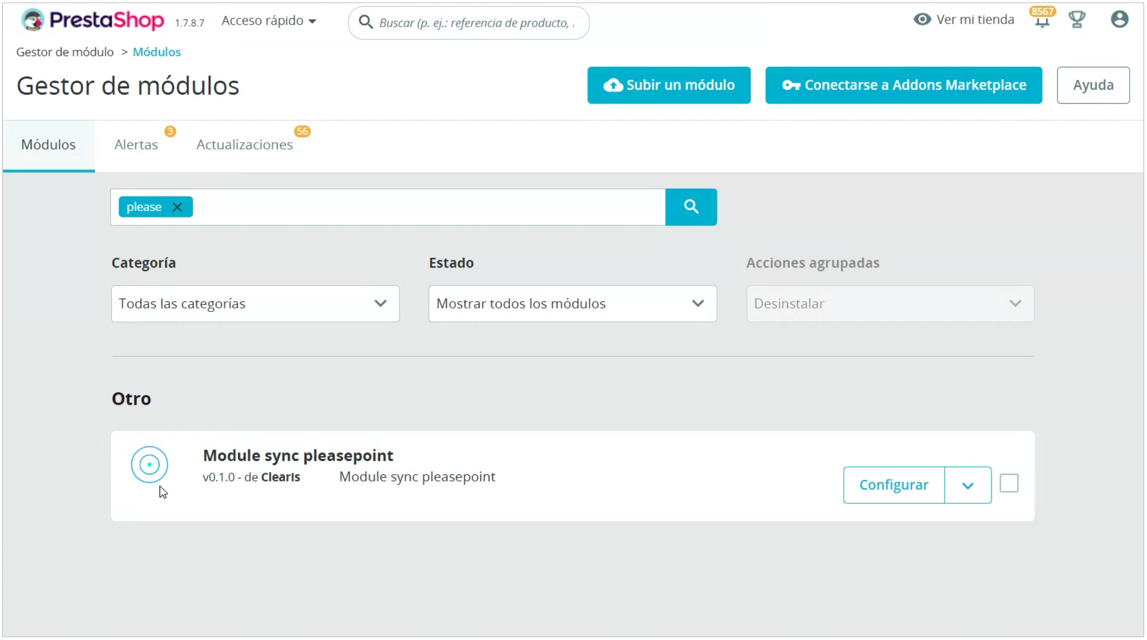
Once your account is created, install the plugin for your eCommerce. Currently, we offer integration with Prestashop, WooCommerce, and Shopify. Install our plugin in your CMS, and your data will be uploaded to your account’s datalake.
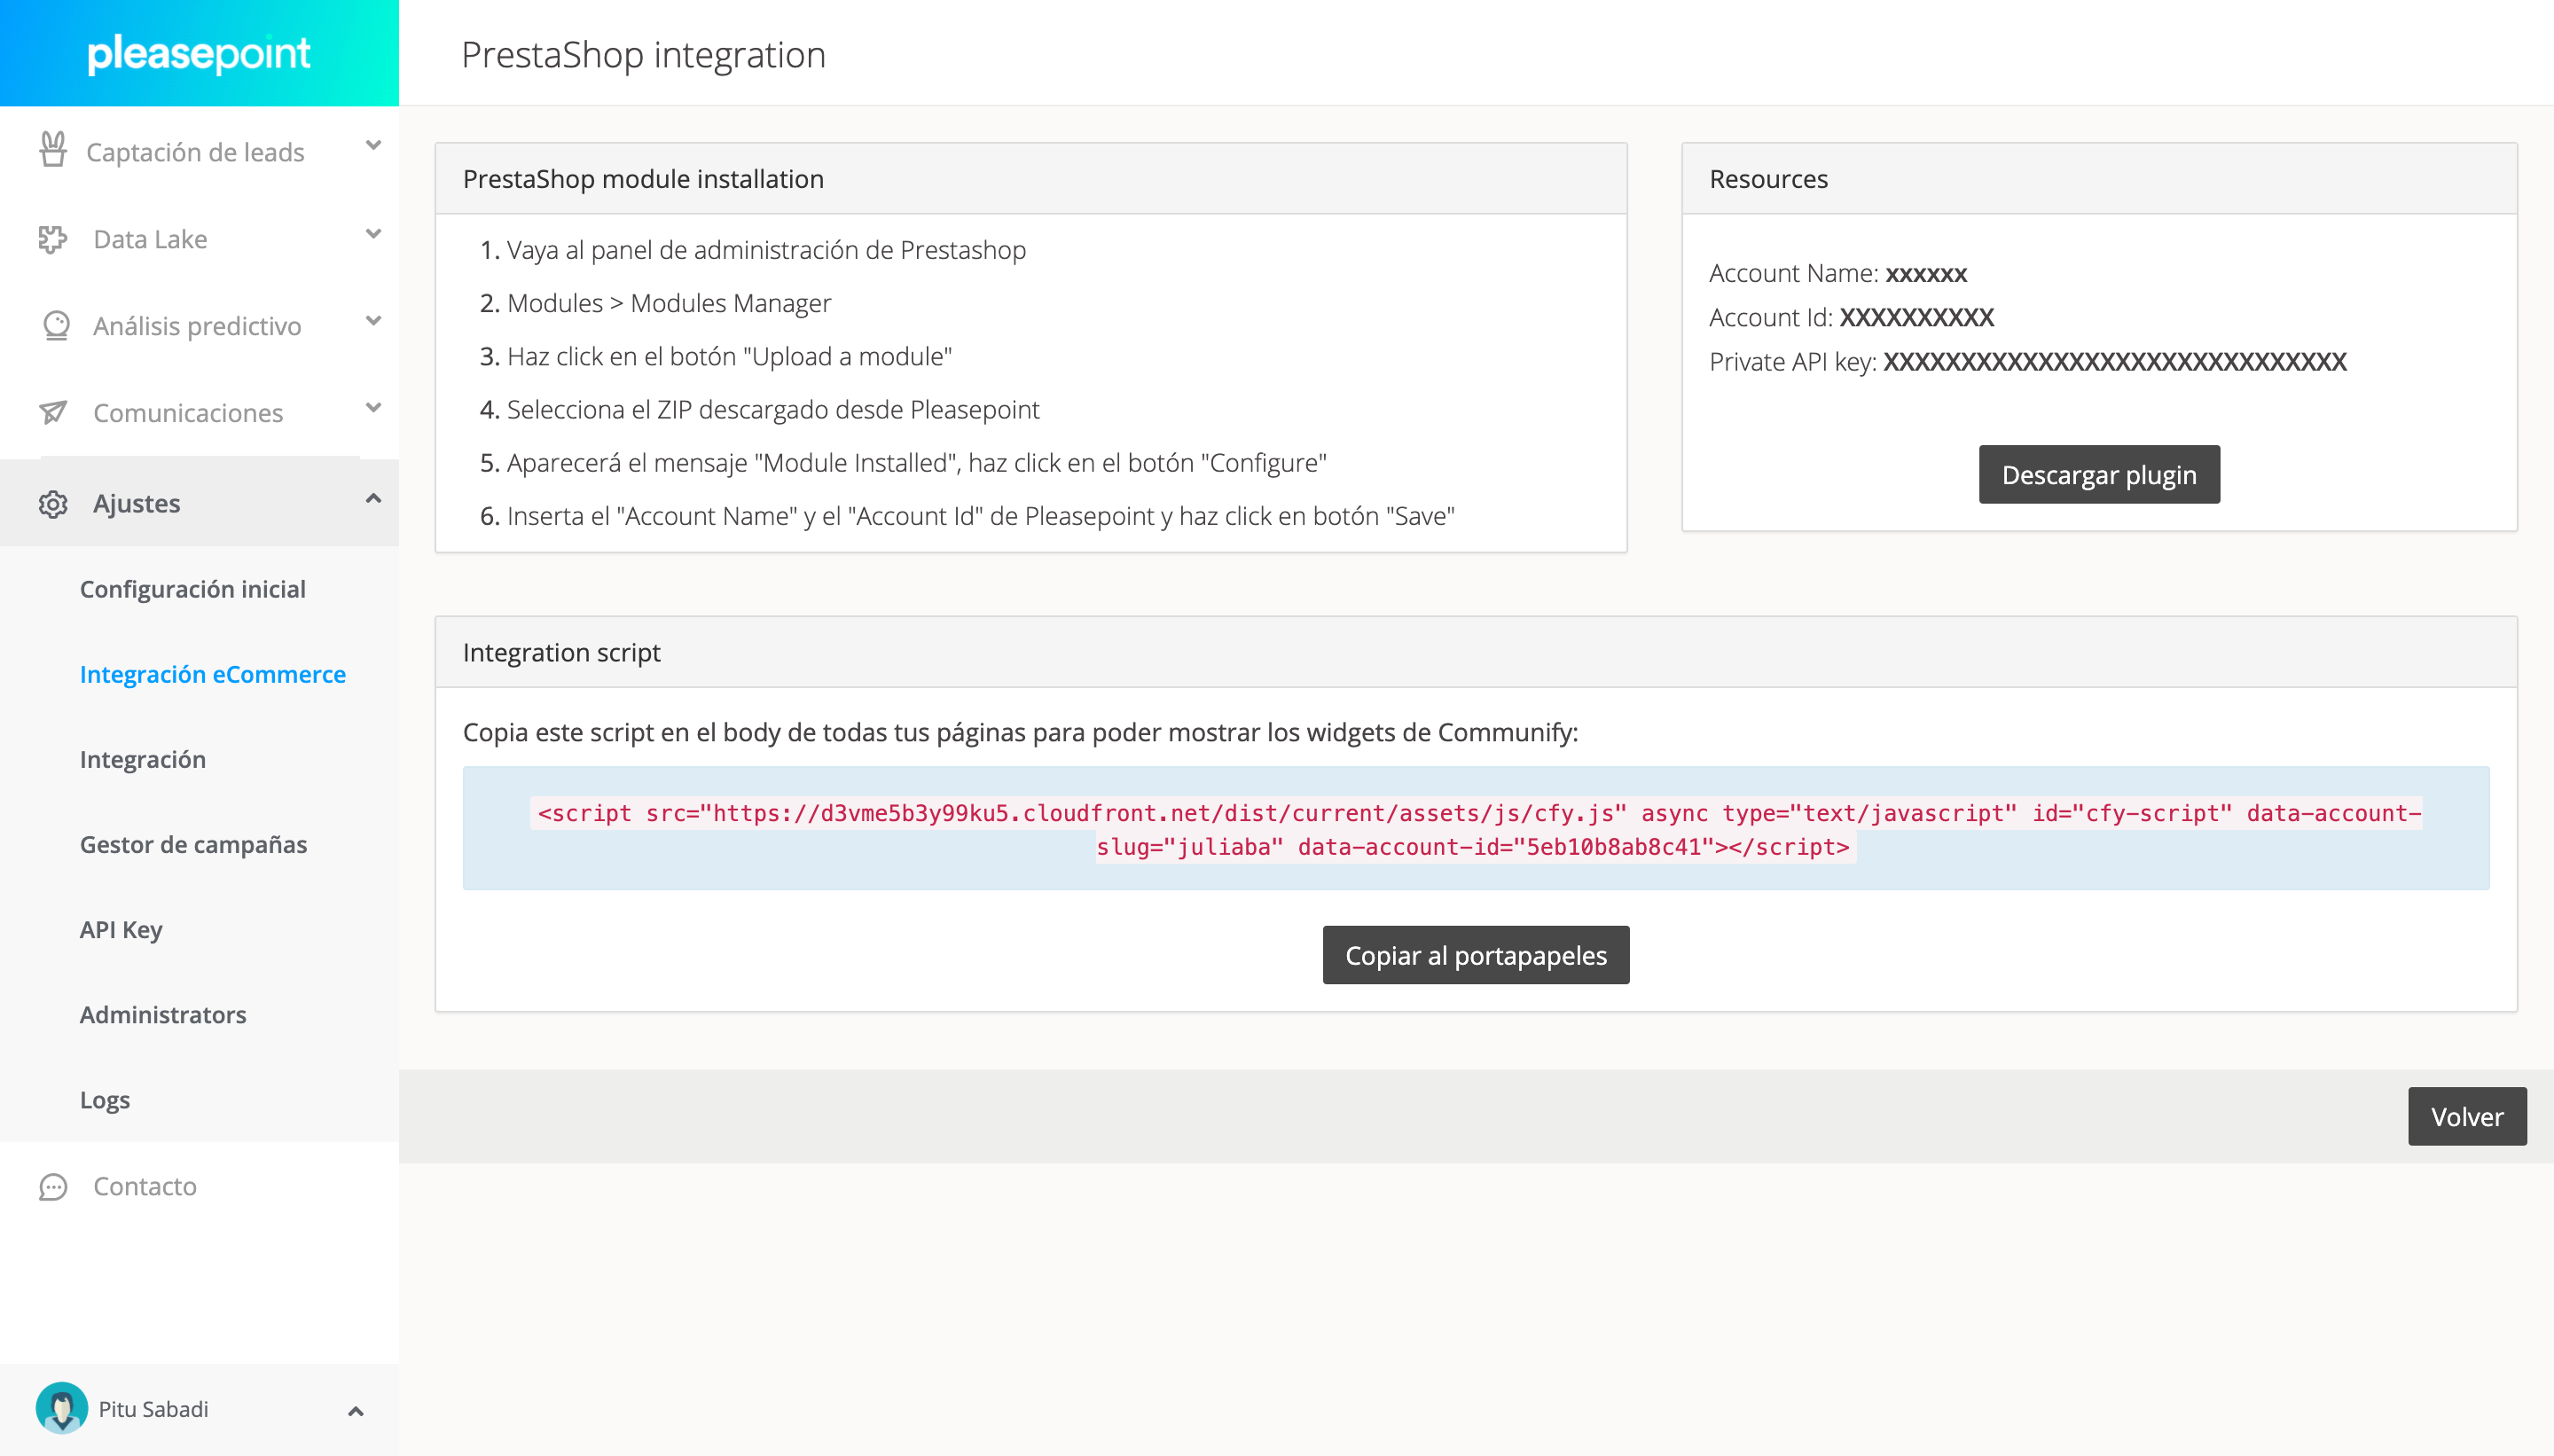
If you need to incorporate other data sources, we recommend using CSV files for data uploads.
If you have any questions during this step, feel free to request a demo, and we will help you with the initial setup. You can schedule your demo using this link.
Once the data is uploaded, you will have access to the information in the datalake section.
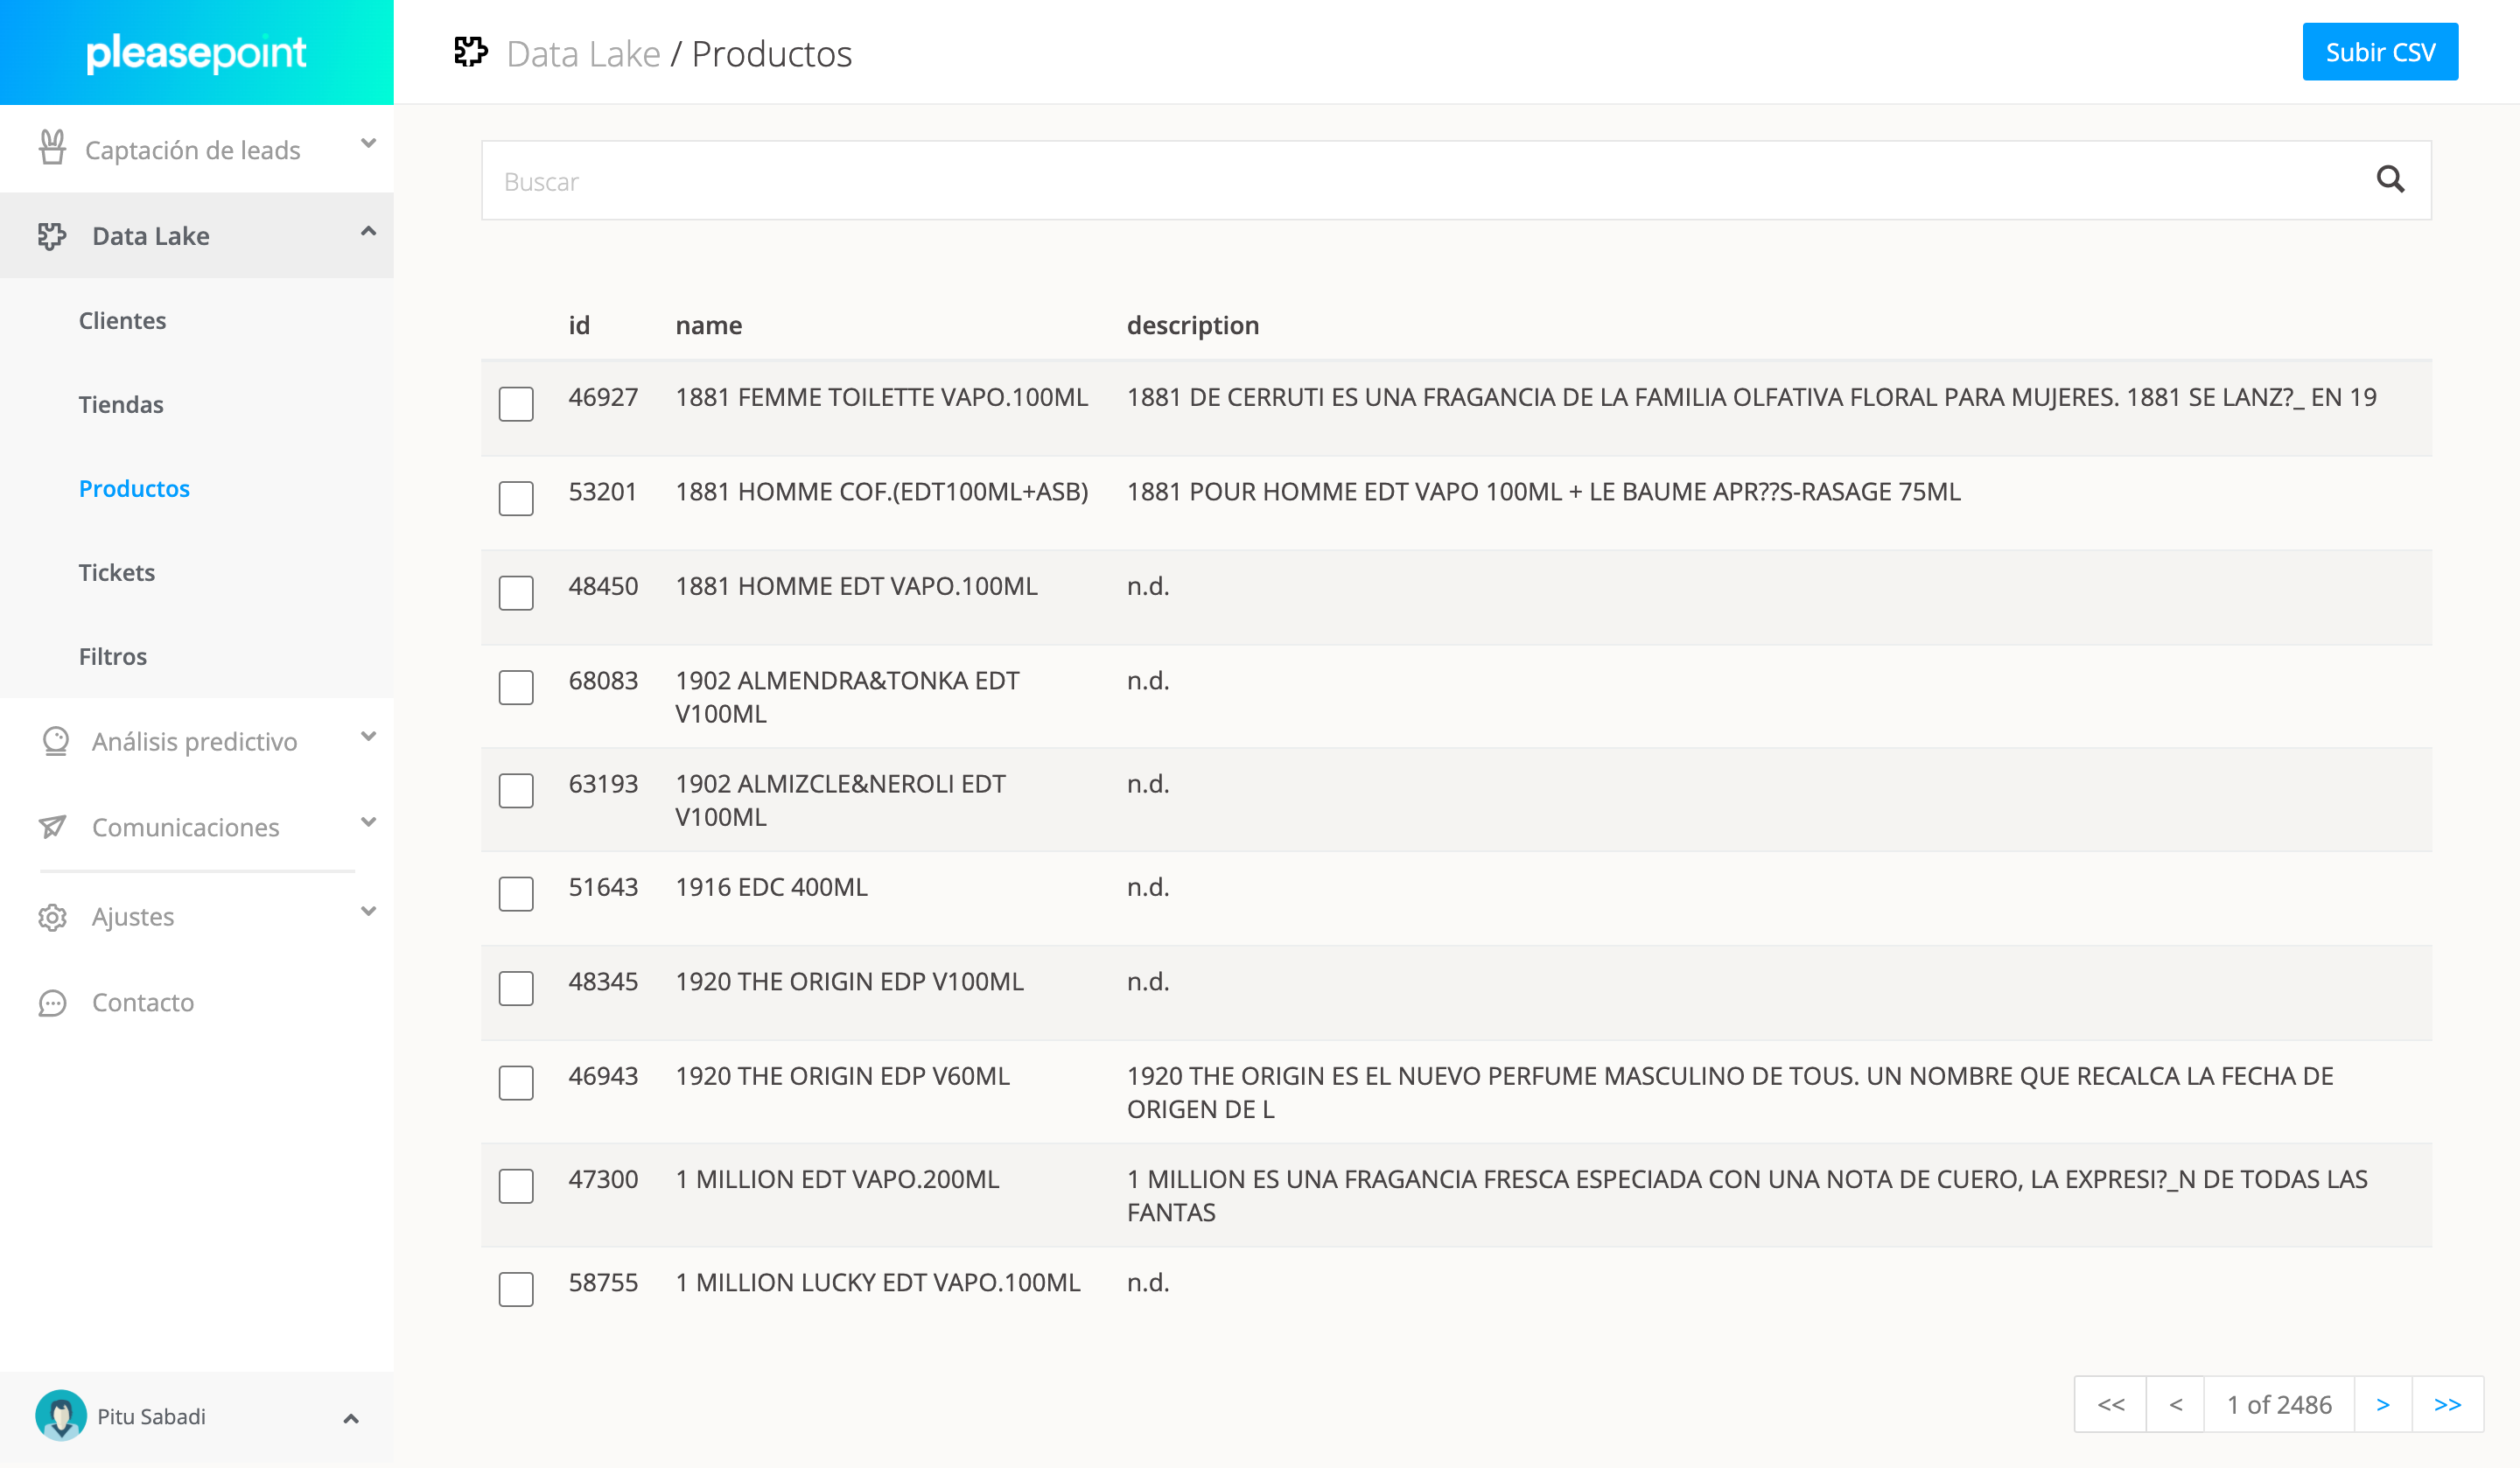
Once the upload process is complete, you can proceed to calculate Customer Lifetime Value and perform the customer-person analysis. If you need help at any step, don’t hesitate to request a demo, and we’ll assist you with the initial setup.
2. Calculating CLV for each customer
The Customer Lifetime Value (CLV) metric gives us insight into the value each customer brings to your business. By increasing the CLV of each customer, you will directly boost your company’s revenue.
These calculations will allow us to create three customer segments, representing three different profitability levels:
- Low Value: This segment represents customers with the least profitability for your business. Typically, a large proportion of eCommerce customers have only made 1 or 2 purchases. We’ll check if that’s the case a bit later.
- Medium Value: These customers are moderately profitable. They buy more frequently than low-value customers, and this group has significant room for improvement since you can work to move them up to the high-value group.
- High Value: These are your best customers—your VIPs. You must keep them as loyal as possible. They buy from you the most and are the most profitable.
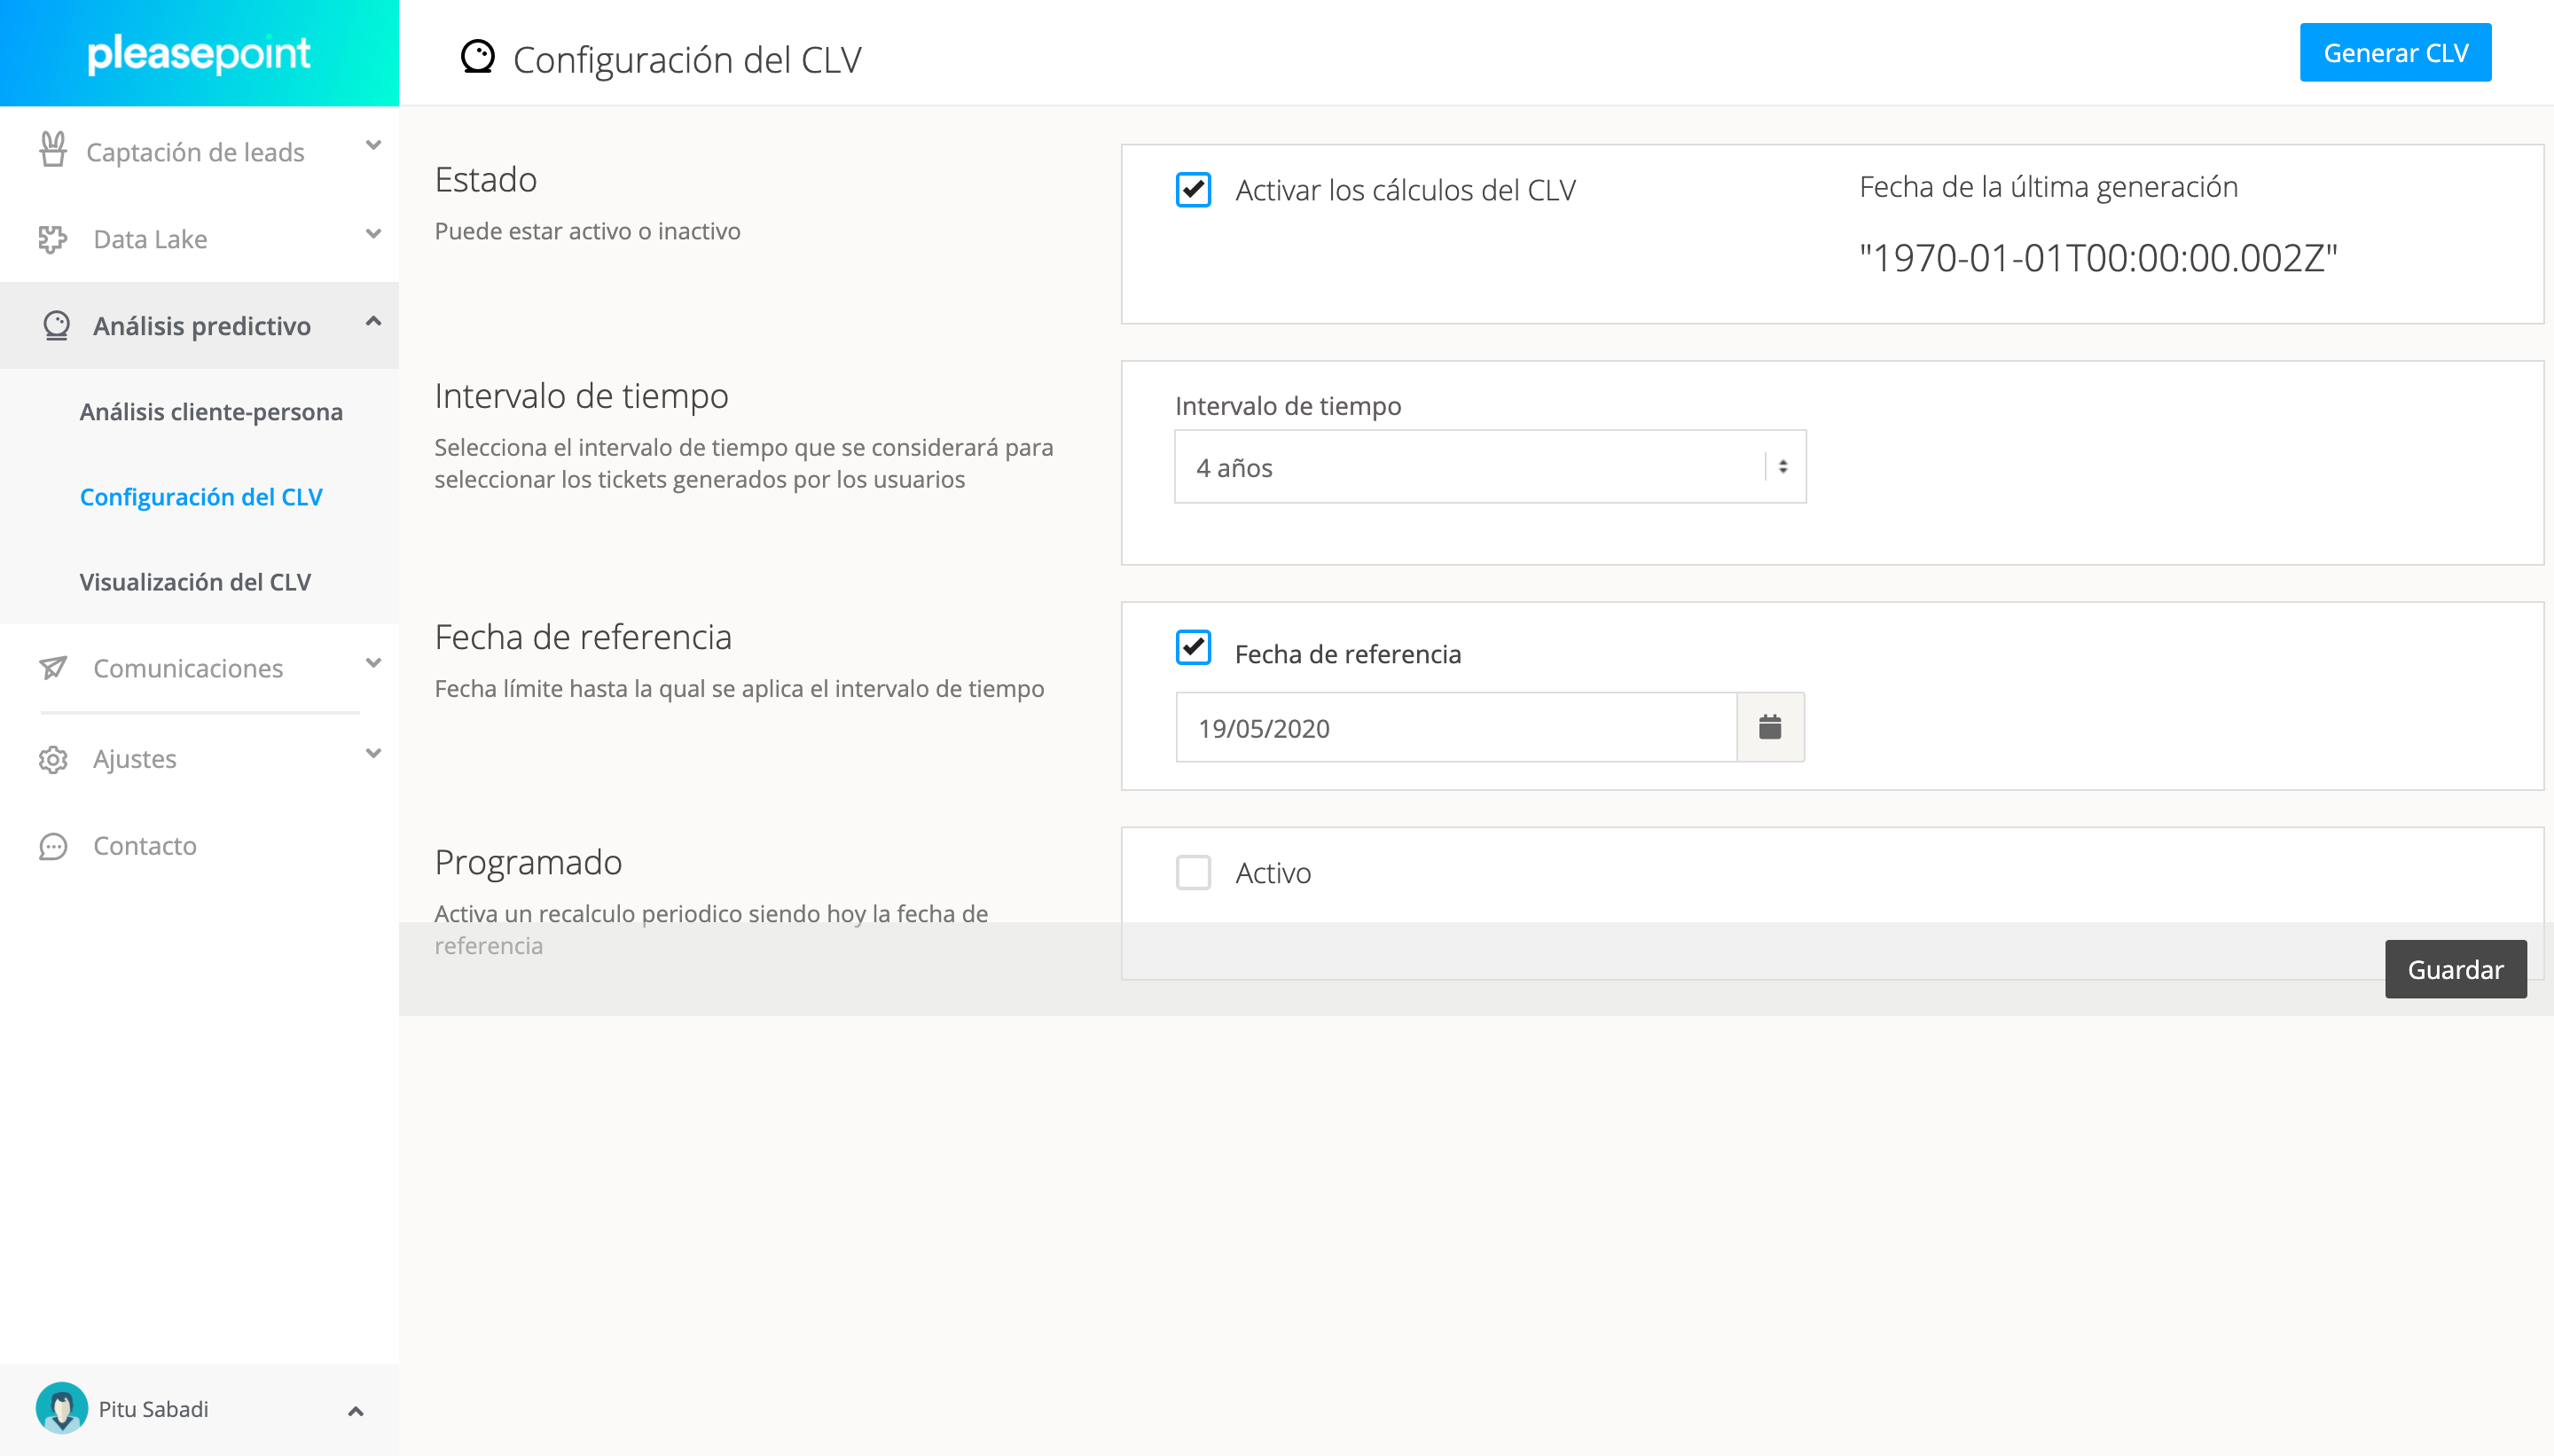
To automate this calculation, go to the "Predictive Analysis" section and the CLV configuration section. Now, you just need to run the CLV generation and wait for the calculation to complete. If you don’t have information on outliers, leave the default settings. Click on “Generate CLV” and wait for the calculation to finish.
As a result, you will have all your customers divided into three groups based on their CLV. You will use this calculation as segmentation in filters to create campaigns or discover different customer-person audiences using predictive analysis techniques.
To better explain the importance of these three groups and save you from having to start crunching numbers, here’s a summary of percentages in terms of customer volume and revenue:
- High: They account for 11.73% of customers and represent 38.93% of revenue.
- Medium: They represent 34.06% of customers and contribute 42.23% of revenue.
- Low: They make up 54.21% of customers but contribute only 18.84% of revenue.
We also see the importance of purchase frequency and average ticket:
- Low: 1.74 purchases per customer with an average ticket of €76.65.
- Medium: 5.52 purchases per customer with an average ticket of €116.95.
- High: 8.79 purchases per customer with an average ticket of €133.61.
Use the segments based on each customer’s value (CLV) to create tailored communication strategies. Work on cross-selling with low-value customers, increase purchase frequency through upselling with medium-value customers, and retain high-value customers.
If you need help calculating CLV, don’t hesitate to request a demo, and we’ll assist you with setting up CLV calculations.
3. Customer-person analysis based on the relationship with each product family
We will now analyze the behavior and consumption habits of each of the three CLV segments. For this example, we will use the total spending value in each of the product subfamilies.
At Pleasepoint, we always recommend conducting this exercise from three different perspectives:
- Product-oriented: For example, as we will do in this case, using total spending in the different product subfamilies.
- Brand-oriented: In the case of multibrand businesses, this same exercise should be performed, but using the propensity to purchase a specific brand. It is advisable to carry this out based on purchase frequency or total spending.
- Behavior-oriented: This setup should focus on aspects such as purchase frequency, average ticket, email open rates, the number of discounted purchases, whether they buy online or in-store...
If you want to learn hands-on how to perform different executions to discover various customer-person profiles, we recommend signing up for the next predictive marketing webinar.
Utiliza la Inteligencia de Pleasepoint para aumentar el ROI de tus acciones de CRM, marketing y publicidad digital.
Pleasepoint es la plataforma de machine learning que segmenta los clientes de tu CRM con predicciones de compra por cliente y personaliza tu marketing digital a escala.
Solicita una demo para ver las ventajas de trabajar la segmentación de clientes utilizando el Customer Lifetime Value, personalizando según el perfil de buyer-persona basado en datos y la recomendación de productos one-to-one.
Solicita una demoBefore diving into the results, let’s understand how the analysis works. In this case, we configure what data we want the dataset to contain. In our case, we are working with product subfamilies and are focusing on total spending within each subfamily.
The type of calculation is important for the results we will obtain. If we use the unit of calculation that measures frequency, the dataset would take repetition into account, meaning low-cost products with a high purchase frequency would stand out in the relevant subfamily.
In our case, we use the total spending calculation. In this case, purchase frequency will not be considered, only the total spending in each category.
Let’s take a look at the results. If you need help with this, schedule a demo with us, and we’ll help you with the initial executions.
Low-segment Audiences
These are the customers contributing the least economically to your eCommerce. The majority have made only one or two purchases. You need to start working on increasing their purchase frequency; you know that when they make more than three purchases, they will move up to a higher profitability level.
Let’s look at a distribution of total spending across seven segments, grouped according to their consumption habits in each of the product subfamilies.
| Cluster ID | Total Customers | Number of Tickets | Total Revenue | Tickets/Customer | Average Ticket | Revenue/Customer |
|---|---|---|---|---|---|---|
| 176 | 2,866 | 4,652 | €406,993.43 | 1.62 | €87.49 | €141.91 |
| 177 | 12 | 32 | €2,157 | 2.67 | €32 | €179.80 |
| 178 | 1,035 | 1,635 | €188,468.87 | 1.58 | €115.27 | €182.10 |
| 179 | 4,359 | 8,141 | €491,597.92 | 1.87 | €60.39 | €112.78 |
| 180 | 75 | 117 | €15,069.13 | 1.56 | €128.80 | €200.92 |
| 181 | 158 | 262 | €33,458.44 | 1.66 | €127.70 | €211.76 |
| 182 | 292 | 518 | €39,340 | 1.77 | €75.95 | €134.73 |
In the table above, we can see how three main groups of customers have formed:
- 176. With 2,866 customers, 1.62 tickets per customer, an average ticket of €87.49, and spending per customer of €141.91.
- 178. With 1,035 customers, 1.58 tickets per customer, an average ticket of €115.27, and spending per customer of €182.10.
- 179. With 4,359 customers, 1.87 tickets per customer, an average ticket of €60.39, and spending per customer of €112.78.
The other groups are smaller, and here is a summary:
- 177. With 12 customers, 2.67 tickets per customer, an average ticket of €32, and spending per customer of €179.80.
- 180. With 75 customers, 1.56 tickets per customer, an average ticket of €128.80, and spending per customer of €200.92.
- 181. With 158 customers, 1.66 tickets per customer, an average ticket of €127.70, and spending per customer of €211.76.
- 182. With 292 customers, 1.77 tickets per customer, an average ticket of €75.95, and spending per customer of €134.73.
Once we have the customer-person breakdown of the seven clusters, let's examine the purchase propensity for each product subfamily. Remember, each column represents a customer cluster, and each row represents a product subfamily.
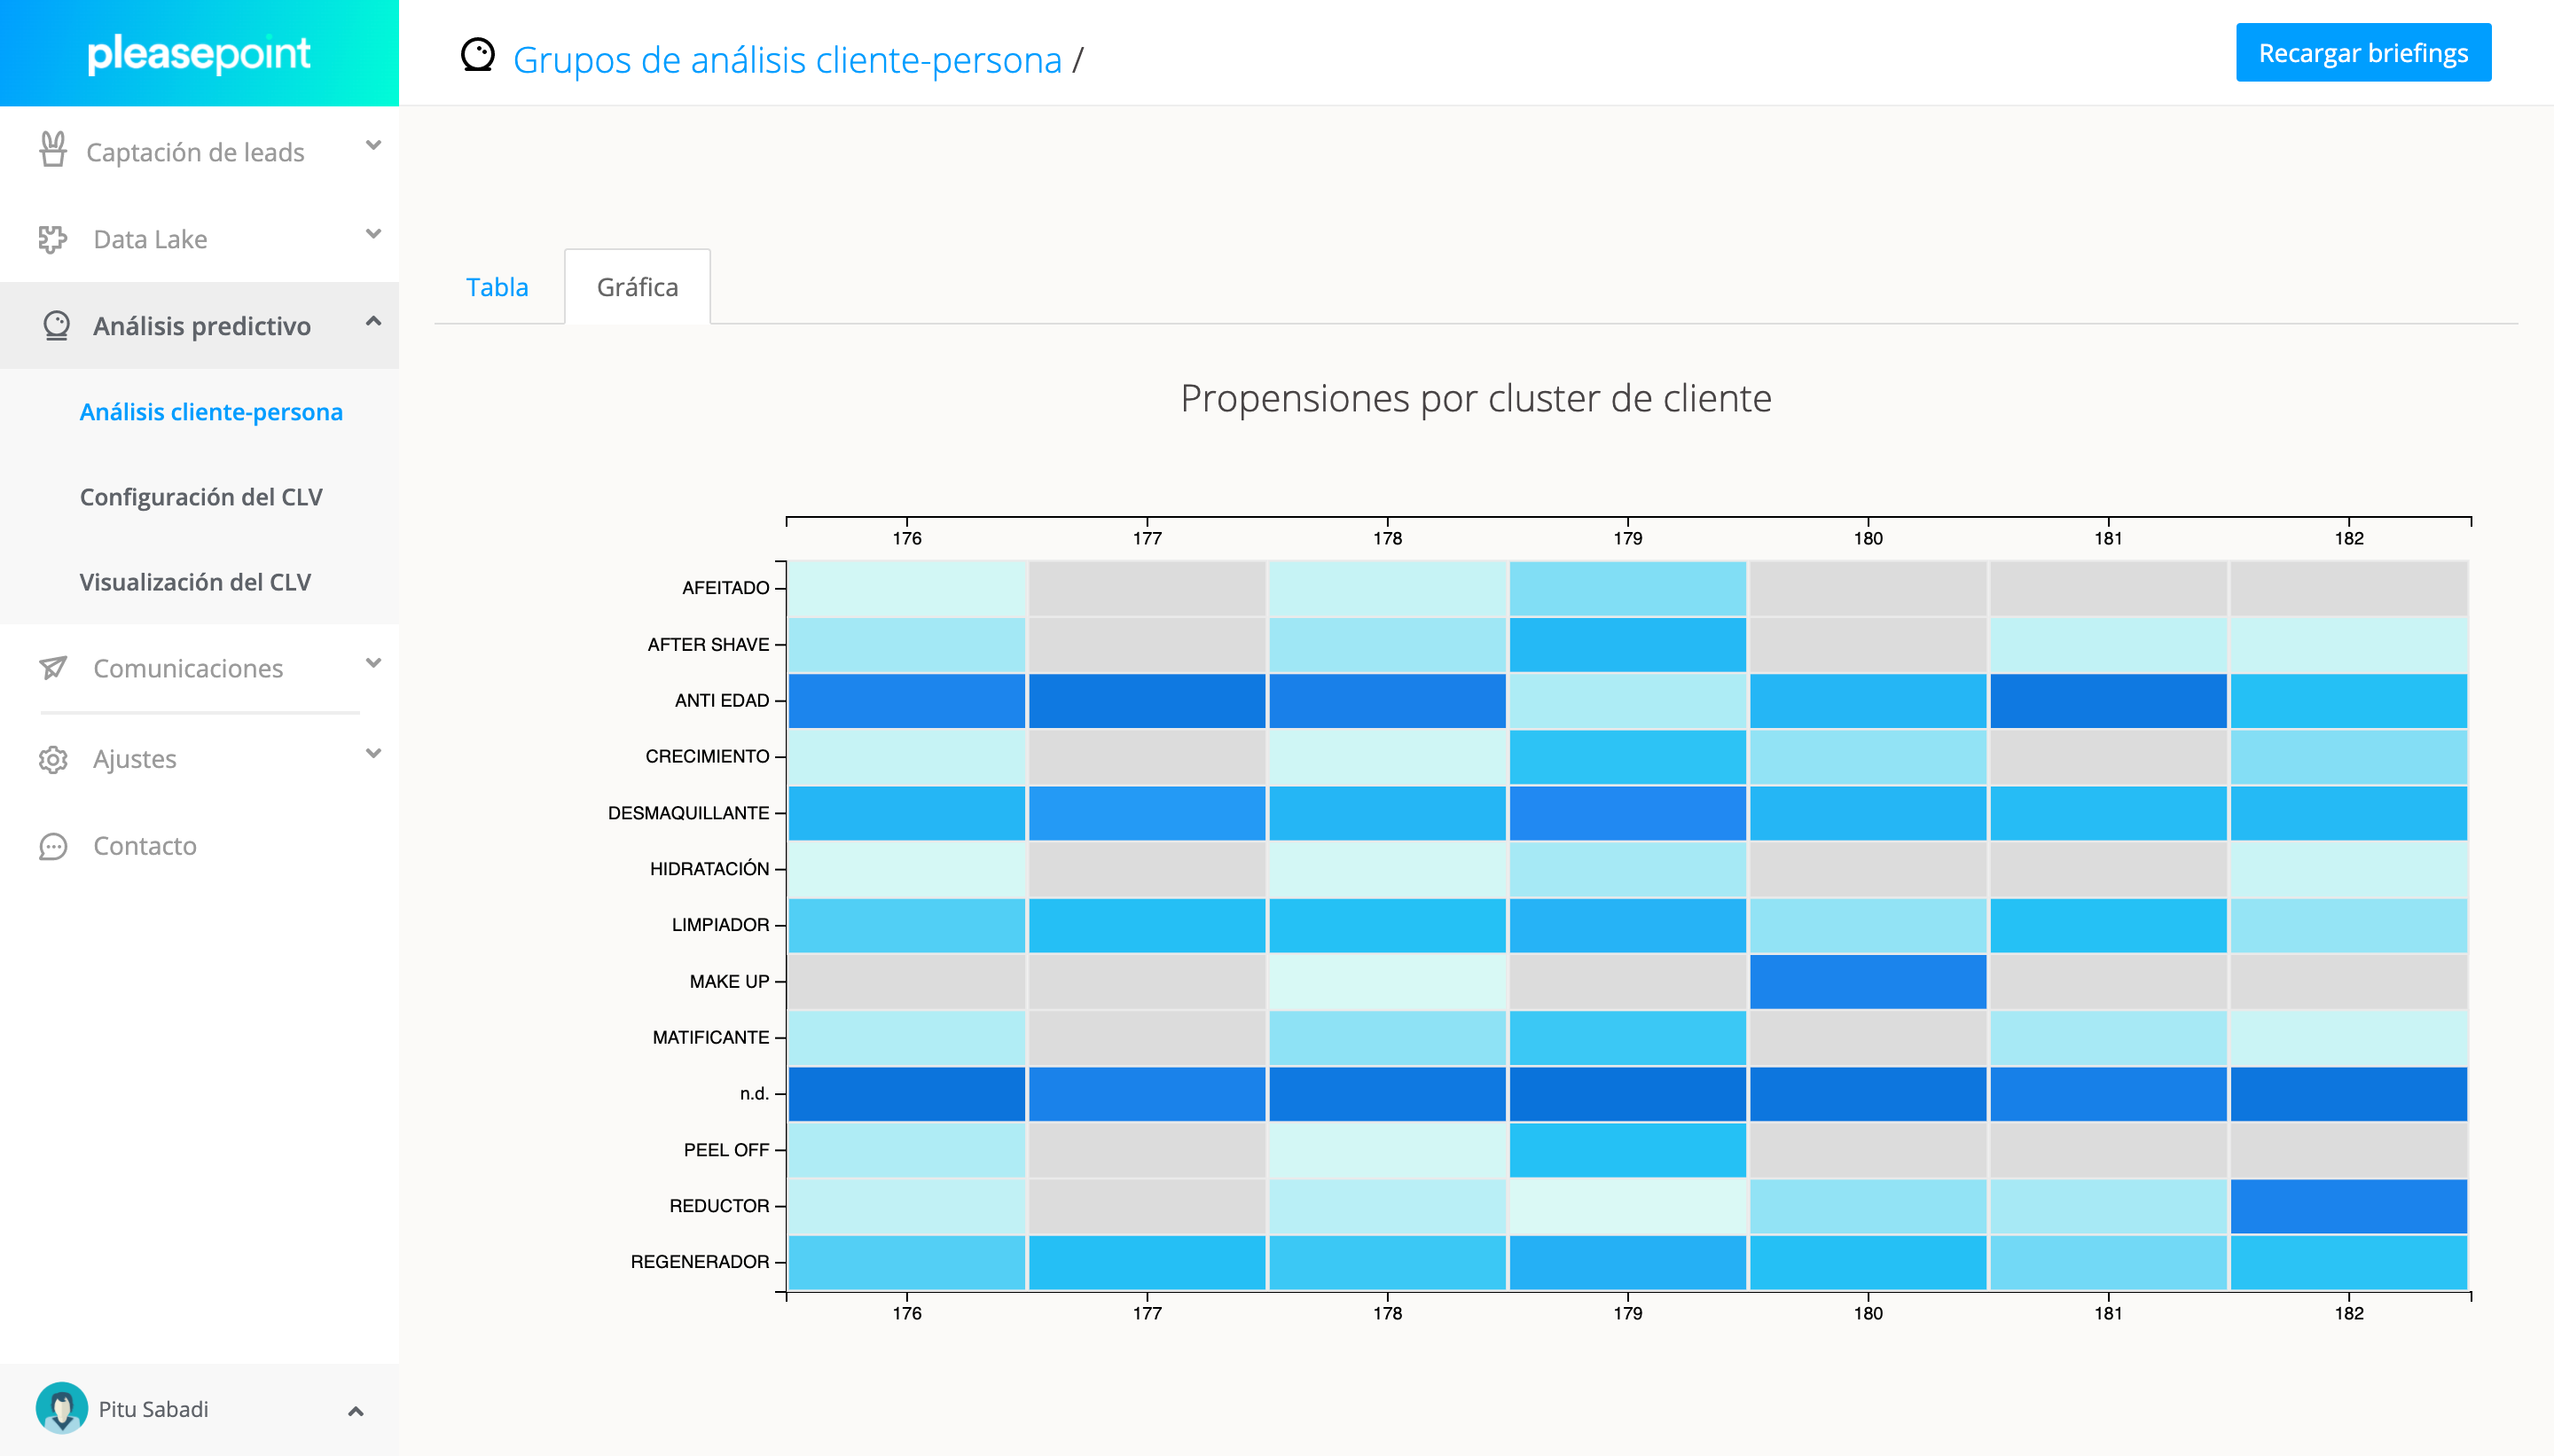
In the chart, gray cells indicate no purchase for that subfamily, and the darker the blue, the greater the purchase propensity. For example, customers in cluster 176 don’t purchase "Make up," and their highest propensity is towards "Anti-aging" products.
Let’s wait until we analyze the three results before making decisions.
Medium-segment Audiences
We perform the same exercise for the medium segment.
| Cluster ID | Total Customers | Number of Tickets | Total Revenue | Tickets/Customer | Average Ticket | Revenue/Customer |
|---|---|---|---|---|---|---|
| 183 | 151 | 749 | €78,451.32 | 4.96 | €104.74 | €519.55 |
| 184 | 1,291 | 4,362 | €606,706.70 | 3.38 | €139.09 | €469.95 |
| 185 | 1,839 | 8,921 | €861,741.46 | 4.85 | €96.60 | €468.59 |
| 186 | 411 | 1,512 | €217,979.85 | 3.68 | €144.17 | €530.36 |
| 187 | 1,573 | 6,123 | €736,284.07 | 3.89 | €120.25 | €468.08 |
| 188 | 29 | 153 | €17,275.25 | 5.28 | €112.91 | €595.70 |
| 189 | 234 | 744 | €120,395.74 | 3.18 | €161.82 | €514.51 |
Now, by looking at the numeric values in the table, we quickly see three main differences compared to the low group:
- The number of tickets per customer: in the case of the low group, it ranged between 1 and 2, while now the numbers fluctuate between 3 and 5.
- The average ticket is significantly higher compared to the low group.
- The sum of both concepts makes the total revenue per customer much higher.
Three major customer groups stand out:
- 184. With 1,291 customers, 3.38 tickets per customer, an average ticket of €139.09, and total spending per customer of €469.95.
- 185. With 1,839 customers, 4.85 tickets per customer, an average ticket of €96.60, and total spending per customer of €468.59.
- 187. With 1,573 customers, 3.89 tickets per customer, an average ticket of €120.25, and total spending per customer of €468.08.
And here is the summary of the four smaller clusters:
- 183. With 151 customers, 4.96 tickets per customer, an average ticket of €104.74, and total spending per customer of €519.55.
- 186. With 411 customers, 3.68 tickets per customer, an average ticket of €144.17, and total spending per customer of €530.36.
- 188. With 29 customers, 5.28 tickets per customer, an average ticket of €112.91, and total spending per customer of €595.70.
- 189. With 234 customers, 3.18 tickets per customer, an average ticket of €161.82, and total spending per customer of €514.51.
Now, let's look at purchase propensities.
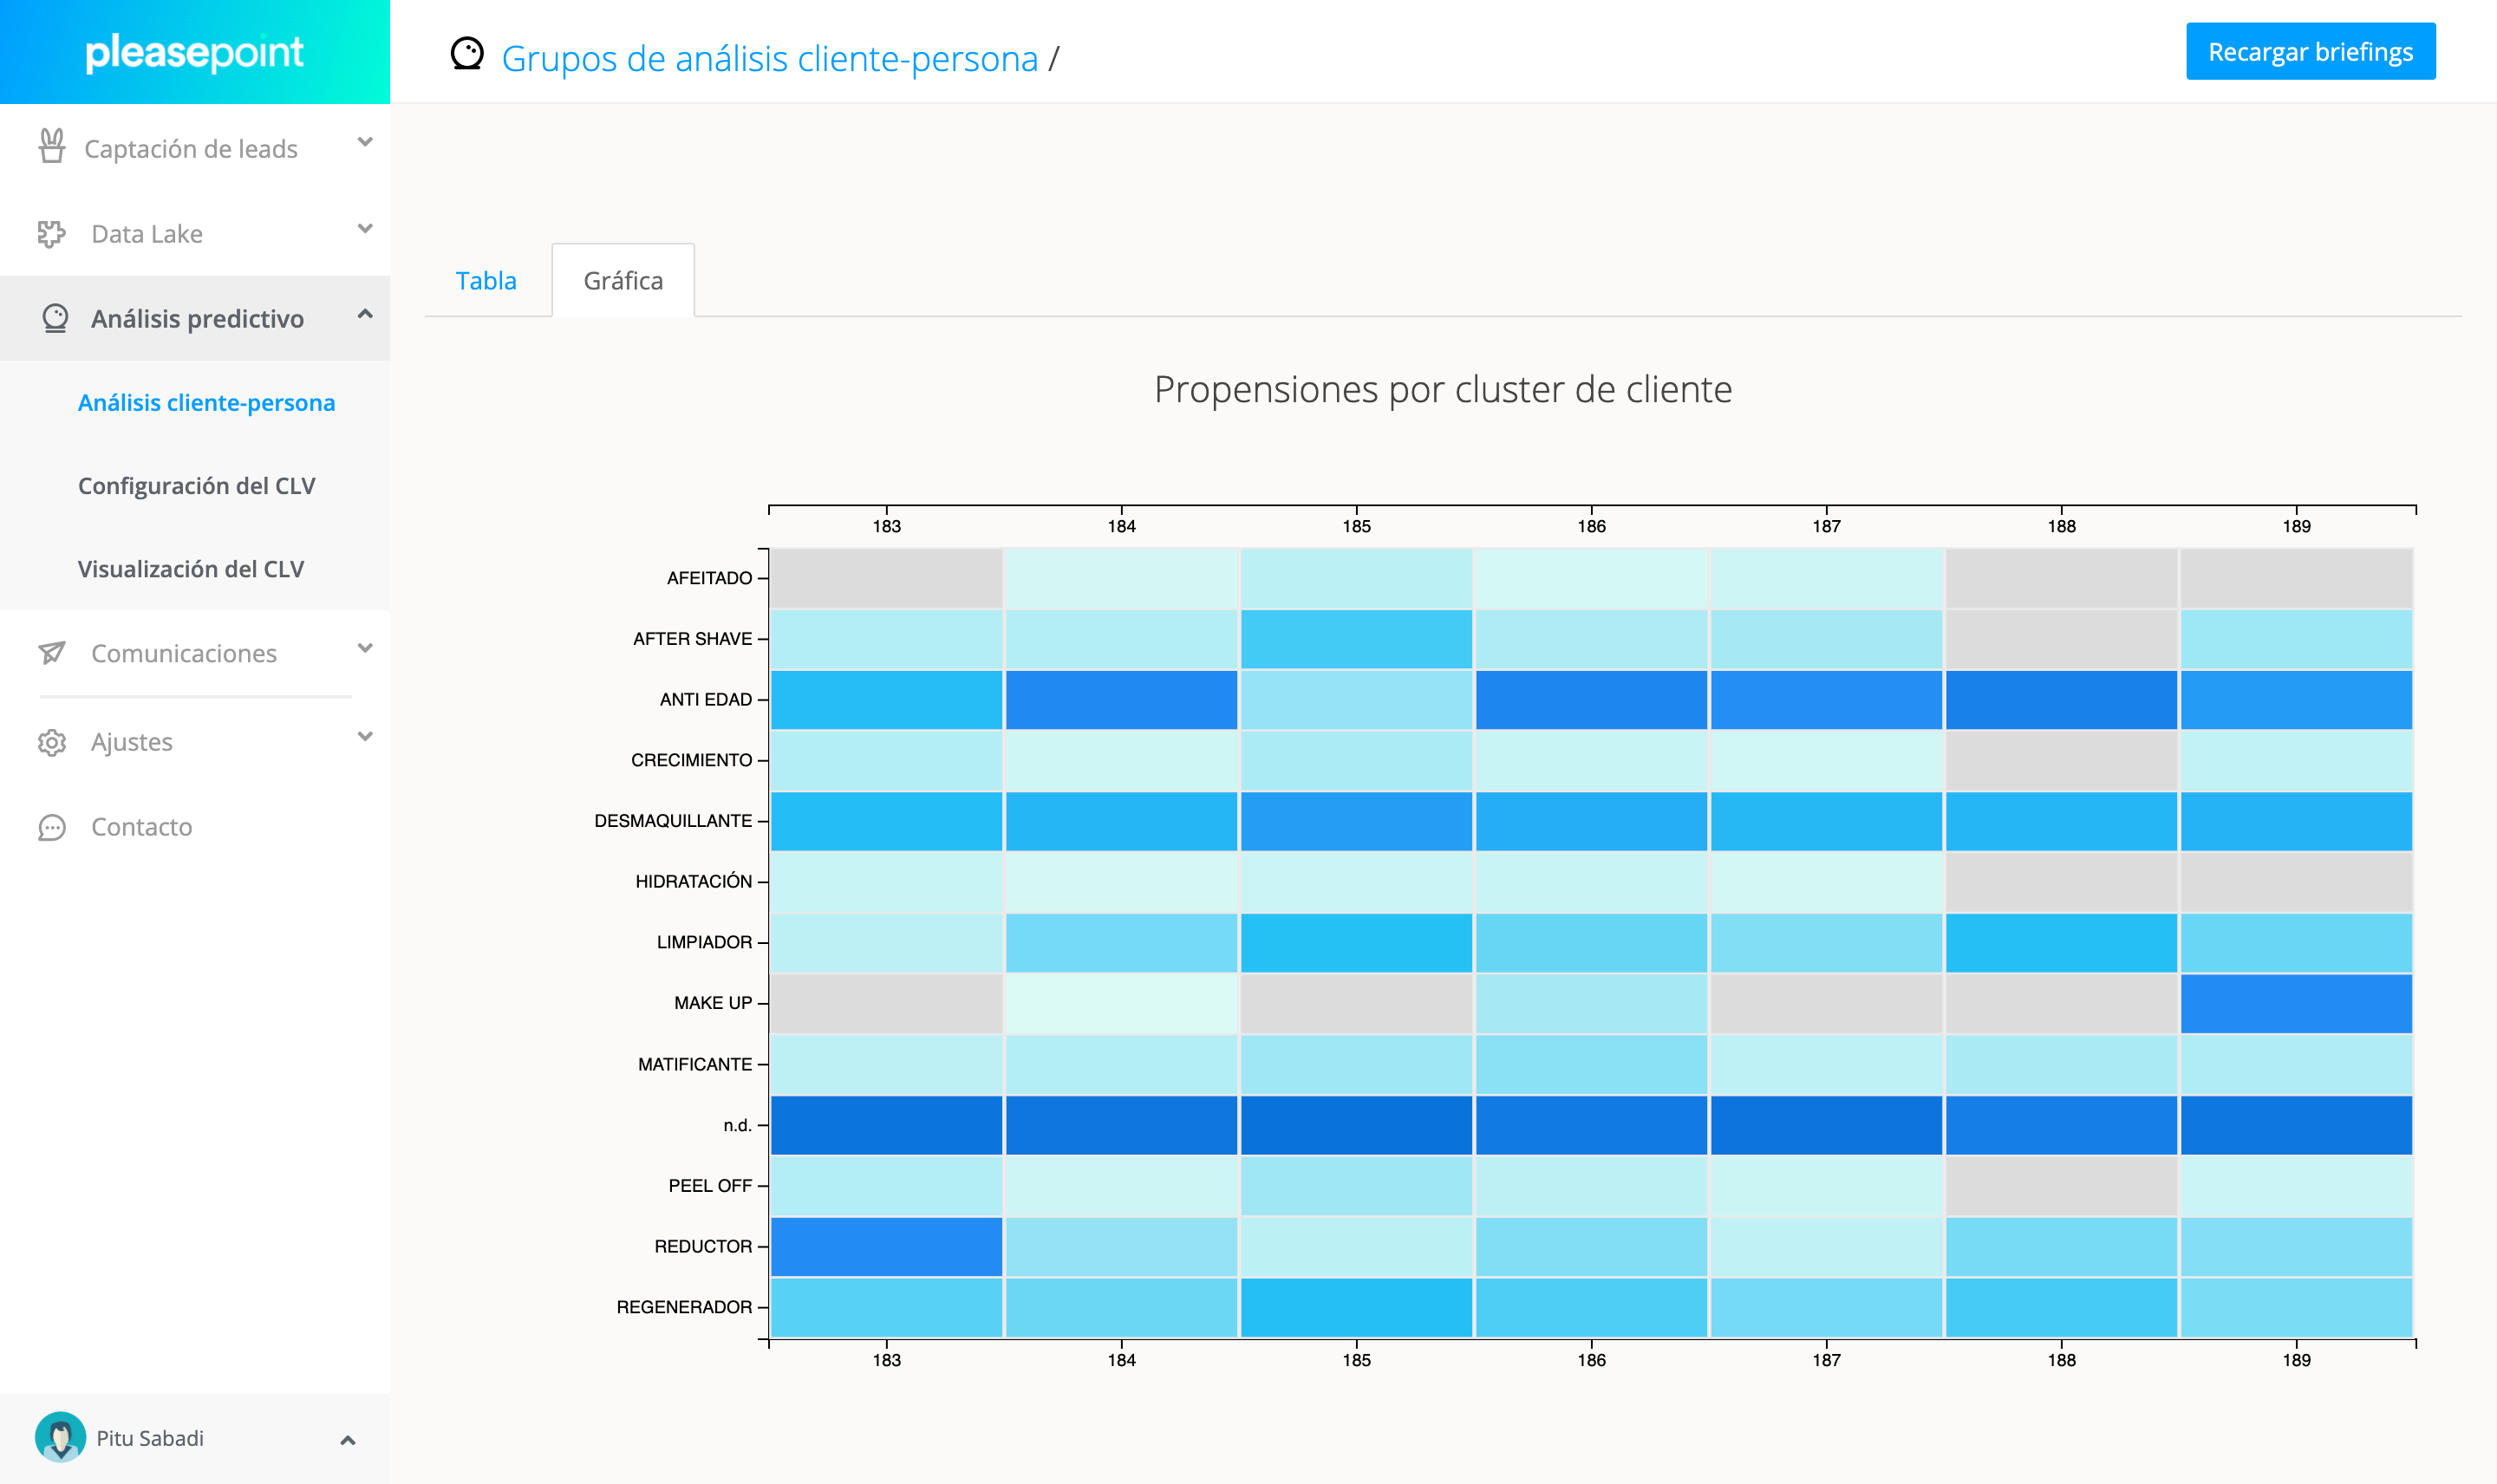
Just by looking at the graph, you can easily see that one of the main differences in purchase propensity compared to the low segment is that now almost all the generated clusters purchase more product subfamilies.
Thus, to move from low to medium, we identify these steps:
- Increase the frequency of purchases.
- Increase the number of product subfamilies purchased.
This will help us when establishing the strategy for personalized campaigns.
High-Segment Audiences
Now let's analyze the best customers, those who contribute the most profitability to the company.
| Cluster ID | Total Customers | Number of Tickets | Total Revenue | Tickets/Customer | Average Ticket | Revenue/Customer |
|---|---|---|---|---|---|---|
| 190 | 688 | 7,368 | €857,222.95 | 10.70 | €116.34 | €1,245.96 |
| 191 | 120 | 1,066 | €166,237.07 | 8.88 | €155.94 | €1,385.31 |
| 192 | 627 | 5,653 | €786,788.63 | 9.01 | €139.18 | €1,254.85 |
| 193 | 47 | 550 | €71,213.18 | 11.70 | €129.48 | €1,515.14 |
| 194 | 122 | 925 | €161,643.89 | 7.58 | €174.75 | €1,324.95 |
| 195 | 265 | 2,295 | €344,297.79 | 8.66 | €150.02 | €1,299.24 |
| 196 | 34 | 352 | €45,559.23 | 10.35 | €129.43 | €1,339.98 |
Comparing this with the medium level, we see these three main differences:
- The number of tickets per customer skyrockets, ranging between 7 and 12 tickets per customer.
- The average ticket rises, but remains within a similar range.
Let's first observe the two largest clusters in terms of customers:
- 190. With 688 customers, 10.70 tickets per customer, an average ticket of €116.34, and total spending per customer of €1,245.96.
- 192. With 627 customers, 9.01 tickets per customer, an average ticket of €139.18, and total spending per customer of €1,254.85.
Now, let’s observe three medium-sized clusters with higher total spending per customer, lower purchase frequency, and higher average tickets:
- 191. With 120 customers, 8.88 tickets per customer, an average ticket of €155.94, and total spending per customer of €1,385.31.
- 194. With 122 customers, 7.58 tickets per customer, an average ticket of €174.75, and total spending per customer of €1,324.95.
- 195. With 265 customers, 8.66 tickets per customer, an average ticket of €150.02, and total spending per customer of €1,299.24.
Finally, let's compare the two smallest clusters:
- 193. With 47 customers, 11.70 tickets per customer, an average ticket of €129.48, and total spending per customer of €1,515.14.
- 196. With 34 customers, 10.35 tickets per customer, an average ticket of €129.43, and total spending per customer of €1,339.98.
These two last clusters represent the customers who buy most frequently and individually contribute the most value.
Now, let's analyze purchase propensity.
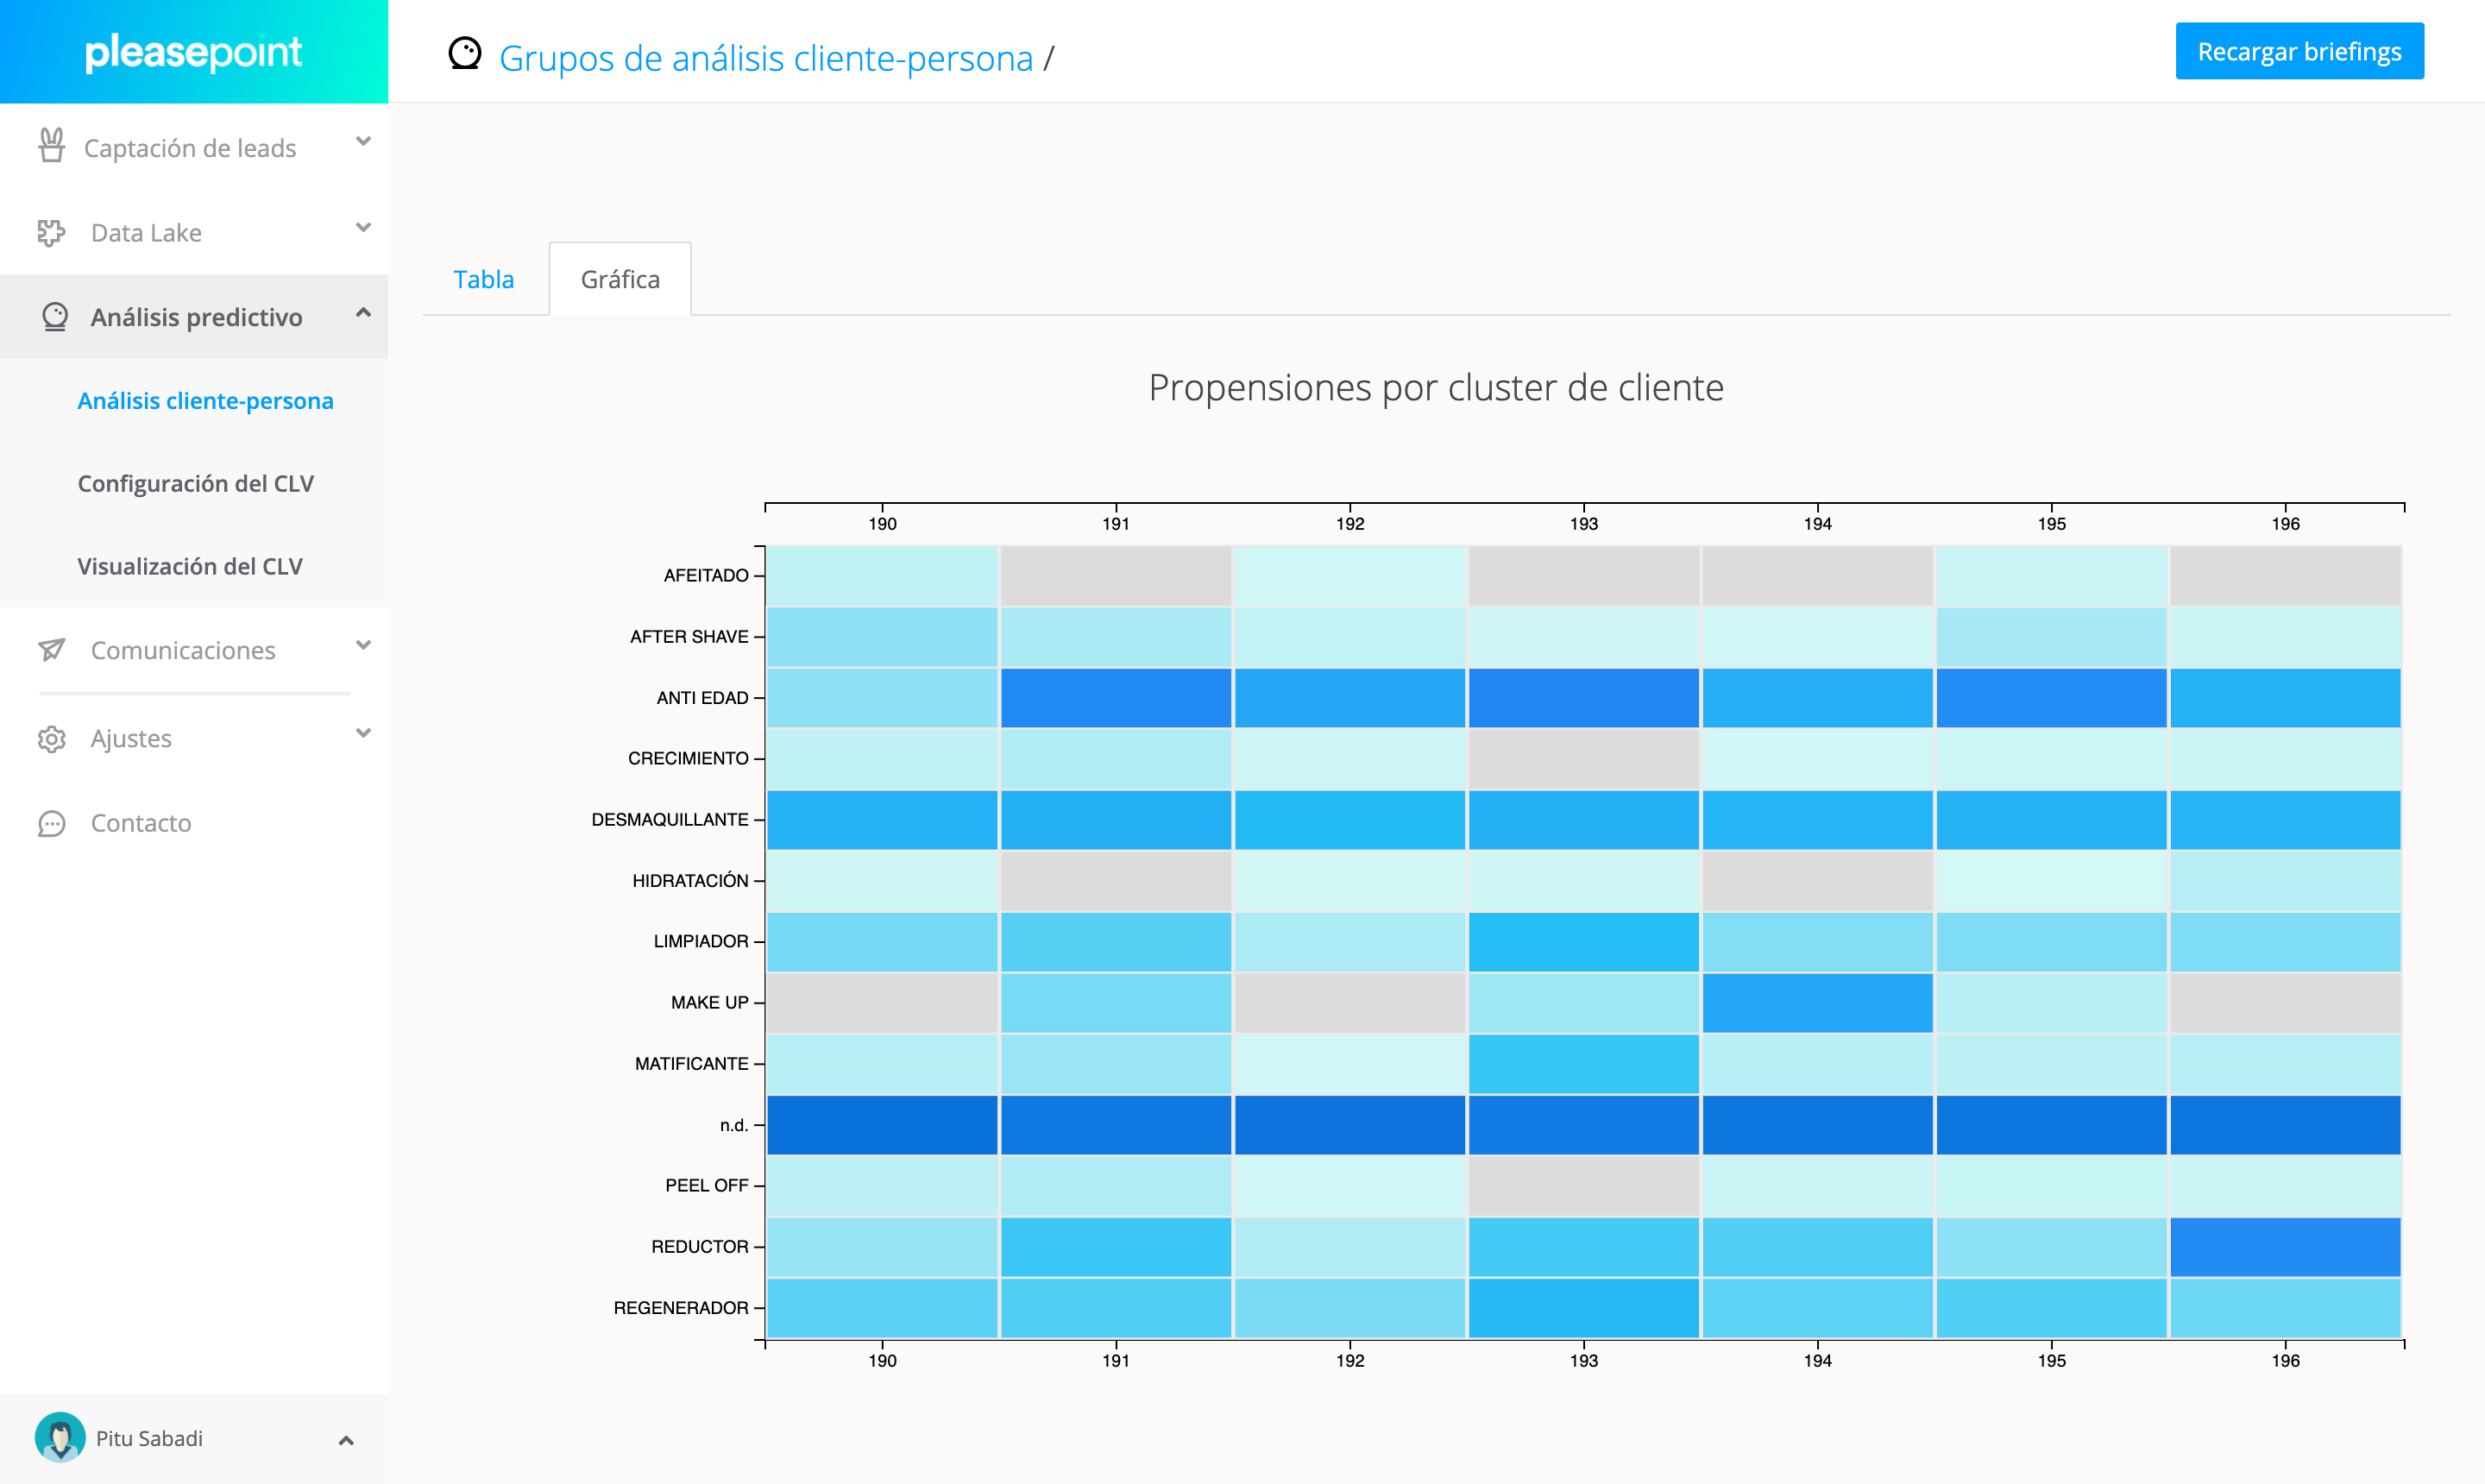
In comparison with the medium-segment customers, we now see that each cluster distributes its spending more evenly across the different categories. These are customers who frequently buy products from various subfamilies.
We can conclude that the move from medium to high is based on:
- Increasing purchase frequency.
- Raising the average ticket by encouraging the purchase of products from different subfamilies.
4. How to create a personalized campaign strategy
If you’ve made it this far, you’re probably eager to know how you can now use this information to create personalized campaigns that will lead customers to move up CLV segments.
Now, let's leverage the information obtained to create more effective campaigns.
Our goal is to increase the total spend of each customer by following a personalized campaign strategy.
We will now show you how to create three distinct strategies based on the profitability level of each customer, personalizing the content of each campaign to match purchasing preferences, while using only 2 email templates.
If you'd like us to explain a real case in a live session, you can sign up for the next predictive marketing webinar.
Dynamic Templates
With two dynamic email templates, we will be able to execute the personalized campaign strategy. One will be a catalog format with product recommendations, and the other will focus on direct product communications with some associated product recommendations.
These two templates give us the flexibility needed to create three types of emails:
- Product catalog emails (featured or promotional items)
- New product launch emails
- Special product promotion emails
These are the two templates.
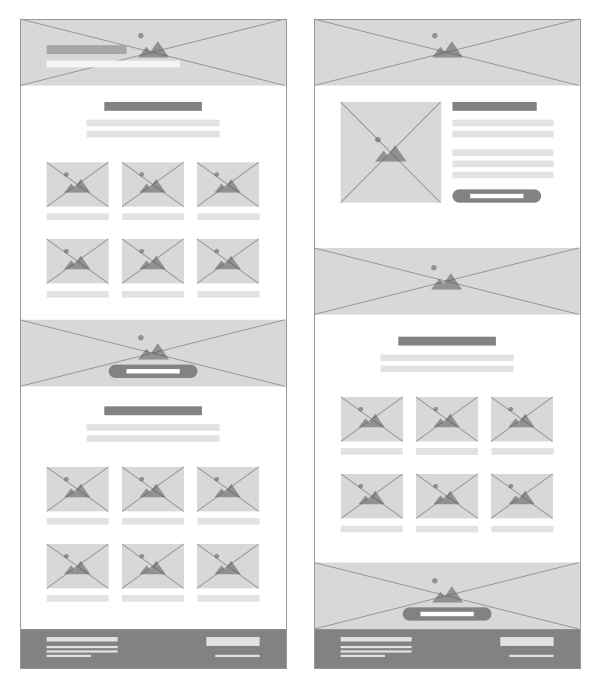
Using the same core content in the campaign, such as the header or the reason for communication, we can personalize the product offering, following a strategy designed to increase each customer’s Customer Lifetime Value.
In product recommendations, it works very well to suggest products with a high purchase propensity along with products the customer hasn't yet purchased but are bought by customers in the higher CLV segments.
In this way, the recommendations will be based on both the customer’s own purchase propensity and that of the higher CLV levels.
Utiliza la Inteligencia de Pleasepoint para aumentar el ROI de tus acciones de CRM, marketing y publicidad digital.
Pleasepoint es la plataforma de machine learning que segmenta los clientes de tu CRM con predicciones de compra por cliente y personaliza tu marketing digital a escala.
Solicita una demo para ver las ventajas de trabajar la segmentación de clientes utilizando el Customer Lifetime Value, personalizando según el perfil de buyer-persona basado en datos y la recomendación de productos one-to-one.
Solicita una demoWe recommend first creating the campaigns manually using these templates. In the future, you can automate part of this process and let the system run on its own, simply setting the products you want to recommend.
Let’s take a look at the strategy to follow for each customer segment.
Strategy for Low-Value Customers
These are the customers who buy the least. They represent 54.21% of customers but only account for 18.84% of the total revenue. The potential for improvement is significant.
Most of these customers have made only one or two purchases. To increase the Customer Lifetime Value of these customers, we will establish the following three communication lines:
- Campaigns to encourage the second purchase.
- Campaigns to encourage the third purchase.
- Campaigns to promote the purchase of other product subfamilies.
Now it's time to get creative. For example, by comparing the Low and Medium clusters, you can observe that one difference is that customers start purchasing products from the "Peel off" subfamily. You can take advantage of this by communicating products they already buy and recommending this product subfamily.
This is the largest customer segment, and there is considerable room for growth. Focus on discovering and understanding the triggers that influence repeat purchases.
Strategy for Medium-Value Customers
Now we move on to medium-value customers. These are customers who have increased their purchase frequency and the number of subfamilies they buy from.
This segment represents 34.06% of customers and accounts for 42.23% of total revenue. These are good customers that we must retain and grow. Our goal is for these customers to move into the high cluster by steadily increasing their purchase frequency.
It's time to focus on repeat purchases. Remember, the key difference between medium and high-value customers is the number of products purchased.
The campaigns for this group will aim to encourage a new purchase. Keep in mind that these customers are already buying from us with some frequency, so we don’t need to cannibalize our products with aggressive promotions.
We can approach this with the following logic:
- Campaigns that promote the purchase of products from different subfamilies.
- Campaigns to replenish products they already buy.
- Promotions for products they have not yet purchased.
You can now begin creating the campaigns. Here, the focus is on promoting the purchase of subfamilies with lower purchase propensity when they buy products from the subfamilies with higher propensity.
For this, product replenishment campaigns are very important. You should not use discounts for products customers are already loyal to—use them for products you want to recommend to improve the average ticket value.
You need to know exactly how to activate these customers. Remember, this is the segment that generates the most revenue for you in terms of volume.
By increasing purchase frequency and slightly improving the average ticket value, you will move these customers from the medium group to the high group.
Strategy for High-Value Customers
Now we move on to the highest-value customers—those who provide the greatest individual contribution to your business’s Customer Lifetime Value. As you have seen, these customers have the highest purchase frequency, and their average ticket value is slightly higher.
These customers should be treated like VIPs. You must keep them loyal and never lose them.
Keep in mind that these customers represent 11.73% of the total customer base but generate 38.93% of the revenue.
Our actions should focus on maintaining their commitment to our brand, reinforcing their connection, and fostering loyalty. Additionally, we can allocate part of the marketing budget to offering these customers special privileges and perks.
In this case, communication strategies should not be promotional (except in special cases) but rather aimed at rewarding the customer. Example campaigns include:
- Free shipping always.
- Exclusive benefits when purchasing new product launches.
- Free gifts after X purchases or based on another business rule.
- Campaigns for replenishing products they already buy.
As always, you should do the math, but don’t skimp on keeping these customers loyal.
I hope you enjoyed this post and that you start using predictive marketing soon to make your communications more personalized, more effective, and more profitable. Now is the time to create your free account and sign up for the next predictive marketing webinar.
Si has llegado hasta aquí esto te interesa.
Pleasepoint es la plataforma de machine learning que segmenta los clientes de tu CRM con predicciones de compra por cliente y personaliza tu marketing digital a escala.
Solicita una demo para ver las ventajas de trabajar la segmentación de clientes utilizando el Customer Lifetime Value, personalizando según el perfil de buyer-persona basado en datos y la recomendación de productos one-to-one.
Solicita una demo5. Bonus track: Lookalike Audiences
And now, one last tip: Use this information not only for customer retention but also for acquiring new customers. How? By creating lookalike audiences of your best customers. This way, you can use this data to better target your advertising campaigns.
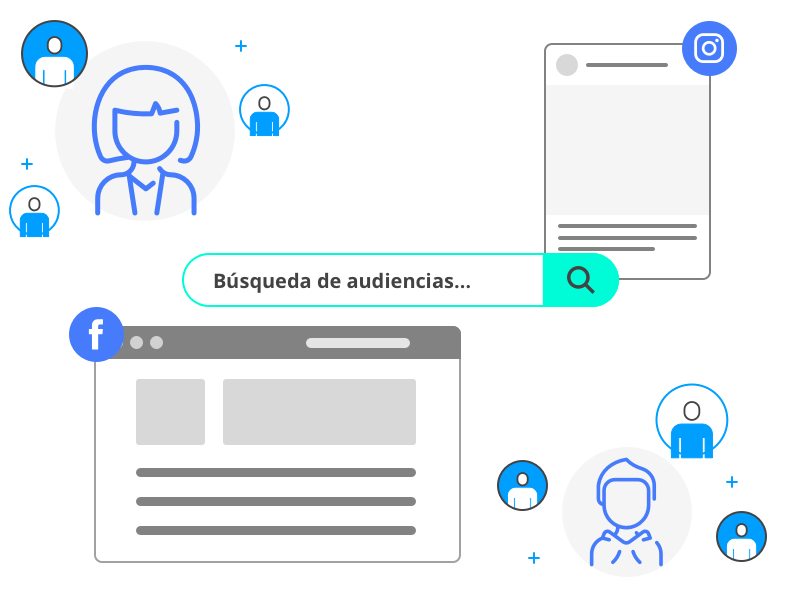
Our experience shows that, although it depends on each business, creating lookalike audiences with High or top Medium customers significantly improves the profitability of customer acquisition campaigns.
Remember, acquiring new customers who only make one or two purchases is not the most profitable strategy. You should focus not just on quantity, but also on the quality of each new customer.